Berichterstattung vs Umfragewerte — Teil 2
Fortsetzung der Untersuchung für alle 2017 relevanten deutschen Parteien
Wie im Falle der AfD (siehe hier) vergleichen wir die Google Trends mit den Infratest Umfragewerten der Parteien CDU, SPD, Linke, Grüne, FDP und AfD.
|
1 2 3 4 5 |
import pandas as pd import matplotlib.pyplot as plt import numpy as np %matplotlib inline |
|
1 2 3 4 5 6 7 8 9 10 11 12 13 14 15 16 17 18 19 20 21 22 23 24 25 26 27 28 29 30 31 32 33 34 35 |
#Reading in all the datasets infra = pd.read_csv('Infratest-Full.csv', delimiter=";") googleCDU = pd.read_csv('Google-CDU.csv', delimiter=";") googleSPD = pd.read_csv('Google-SPD.csv', delimiter=";") googleLinke = pd.read_csv('Google-Linke.csv', delimiter=";") googleB90 = pd.read_csv('Google-B90.csv', delimiter=";") googleFDP = pd.read_csv('Google-FDP.csv', delimiter=";") googlePiraten = pd.read_csv('Google-Piraten.csv', delimiter=";") googleAFD = pd.read_csv('Google-AFD.csv', delimiter=";") #Converting the date formats in the files to a standard one infra['Date'] = pd.to_datetime(infra['Date'], format="%d.%m.%y") googleCDU['Date'] = pd.to_datetime(googleCDU['Date']) googleSPD['Date'] = pd.to_datetime(googleSPD['Date']) googleLinke['Date'] = pd.to_datetime(googleLinke['Date']) googleB90['Date'] = pd.to_datetime(googleB90['Date']) googleFDP['Date'] = pd.to_datetime(googleFDP['Date']) googlePiraten['Date'] = pd.to_datetime(googlePiraten['Date']) googleAFD['Date'] = pd.to_datetime(googleAFD['Date']) #Setting the date column to be the index infra.set_index(['Date'], inplace=True) googleCDU.set_index(['Date'], inplace=True) googleSPD.set_index(['Date'], inplace=True) googleLinke.set_index(['Date'], inplace=True) googleB90.set_index(['Date'], inplace=True) googleFDP.set_index(['Date'], inplace=True) googlePiraten.set_index(['Date'], inplace=True) googleAFD.set_index(['Date'], inplace=True) #Dropping the 'others' column in infratest infra.drop('Sonstige', axis=1, inplace=True) |
|
1 2 3 4 5 6 7 8 9 10 |
#Joining all the datasets full = infra full = full.join(googleCDU, how='outer') full = full.join(googleSPD, how='outer') full = full.join(googleLinke, how='outer') full = full.join(googleB90, how='outer') full = full.join(googleFDP, how='outer') full = full.join(googleAFD, how='outer') full = full.join(googlePiraten, how='outer') |
|
1 2 3 4 5 6 7 8 9 10 11 12 |
#Only interested in data since 2014-01-01 (after last Bundestagswahl) full = full['2014-01-01':] full['FDP'] = pd.to_numeric(full['FDP'], errors='coerce') full['AFD'] = pd.to_numeric(full['AFD'], errors='coerce') full['Piraten'] = pd.to_numeric(full['Piraten'], errors='coerce') #Average over 4-weekly buckets data = full.resample('4W').mean() #There are actually no infra data for the Piraten, so we drop them data.drop('Piraten', axis=1, inplace=True) data.drop('Google-Piraten', axis=1, inplace=True) |
|
1 2 3 4 5 6 7 8 9 10 11 12 13 14 15 16 17 18 19 20 21 22 23 24 25 26 27 28 29 30 |
#Couple of functions for plotting and normalizing #Normalise the Data def normalize(df): result = df.copy() for feature_name in df.columns: max_value = df[feature_name].max() min_value = df[feature_name].min() result[feature_name] = (df[feature_name] - min_value) / (max_value - min_value) return result #Plot the Data def plotData(dataset, secondaryData, leftLabel, rightLabel): plt.figure(figsize=(20,20), dpi=300) ax = dataset.plot(secondary_y=[secondaryData]) ax.set_ylabel(leftLabel, color='g') ax.right_ax.set_ylabel(rightLabel, color='b') ax.grid(color='k', axis='x', which='both') ax.grid(color='g', axis='y') ax.right_ax.grid(color='b', axis='y') #ax.legend_.remove() #Plot a dict (for correlation dicts) def plotDict(d): lists = sorted(d.items()) # sorted by key, return a list of tuples x, y = zip(*lists) # unpack a list of pairs into two tuples plt.figure(figsize=(4,4), dpi=300) plt.plot(x, y) plt.show() |
|
1 2 3 |
#Normalize our dataset data_norm = normalize(data) |
Plots der Verläufe von Google Trends gegen Sonntagsfrage
|
1 2 3 4 5 6 |
#plot (non-normalized) news vs survey for each party parties = ('CDU', 'SPD', 'Linke', 'B90', 'FDP', 'AFD') for party in parties: plotData(data.loc[:,[party, 'Google-%s' %party]], secondaryData=party,leftLabel='Google Trend zu %s' %party, rightLabel= 'Infratest-Umfragewerte von %s' %party) |

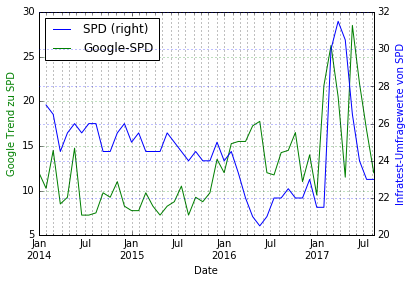
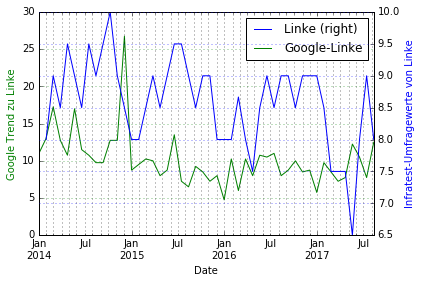
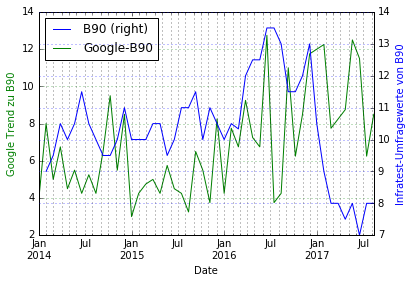
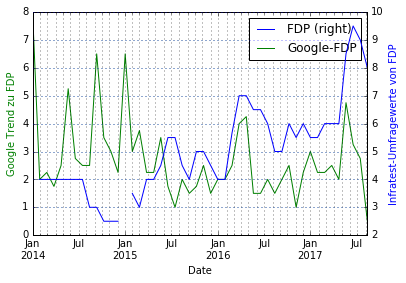
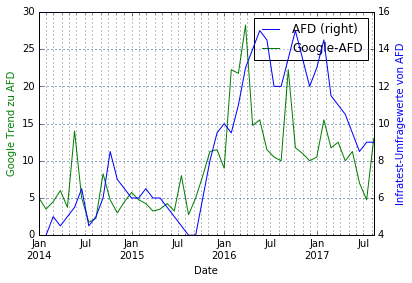
Wir beobachten einige interessante Verläufe:
- CDU: Die Verläufe antikorrelieren teilweise stark. Sprich: Je weniger berichtet wird, desto höher ist die Zustimmung zur Union. Asymmetrische Demobiliserung scheint zumindest also insofern zu funktionieren, dass die Unionswähler nicht abwandern, wenn die Partei nicht in den Medien präsent ist. Vorgehen: Den CDU-News-Trend gegen die SPD-Sonntagsfrage betrachten
- Bei der FDP, der SPD und der AfD korrelieren Berichterstattung und Umfragewerte stark. Vorgehen: Korrelation berechnen, ggfs wieder zeitliche Verschiebung finden
- Die Grünen konnten ab etwa Anfang 2017 über der Berichterstattung über die Partei nicht glücklich sein — die starke Berichterstattung führte zu fallenden Umfragewerten
|
1 2 3 |
#Comparison SPD Infra vs CDU Google plotData(data.loc[:,['SPD','Google-CDU']], secondaryData='SPD', leftLabel='Google Trend zur CDU', rightLabel='Umfragewerte der SPD') |

Asymmetrische Demobilisierung
Tatsächlich scheint die SPD eher dann Wähler zu verlieren, wenn die Union mehr mediale Aufmerksamkeit bekommt. Diese Hälfte der asymmetrischen Demobiliserung funktioniert offenbar weniger gut.
|
1 2 3 4 5 6 7 8 9 10 11 12 13 14 15 16 17 18 19 20 21 |
#Computation of correlation between coverage and infratest data by shifting the Google data from -50 to +50 days, #comupute correlation every day, find maximum def correlationShiftComparison(df, coverage, survey): shiftRange = range(-50,51) correlationDict = {} coverageData = df[coverage].copy().to_frame() surveyData = df[survey].copy().to_frame() #Looping over shiftRange, shifting google, combining datasets, computing correlation for shift in shiftRange: shiftedSet = coverageData.copy() shiftedSet.index = shiftedSet.index + pd.DateOffset(days=shift) combined = shiftedSet.join(surveyData, how='outer') combined_resampled = combined.resample('4W').mean() correlationDict[shift] = combined_resampled.corr()[coverage][survey] #shiftOfHighestCorrelation = sorted(correlationDict, key=correlationDict.get, reverse=True)[0] #highestCorrelation = correlationDict[shiftOfHighestCorrelation] return correlationDict |
|
1 2 3 4 5 6 7 8 |
CDUCorrelationDict = correlationShiftComparison(full, 'Google-CDU', 'CDU') SPDCorrelationDict = correlationShiftComparison(full, 'Google-SPD', 'SPD') LinkeCorrelationDict = correlationShiftComparison(full, 'Google-Linke', 'Linke') B90CorrelationDict = correlationShiftComparison(full, 'Google-B90', 'B90') FDPCorrelationDict = correlationShiftComparison(full, 'Google-FDP', 'FDP') AFDCorrelationDict = correlationShiftComparison(full, 'Google-AFD', 'AFD') allCorrelationDicts = { 'CDU': CDUCorrelationDict, 'SPD': SPDCorrelationDict, 'Linke': LinkeCorrelationDict, 'B90': B90CorrelationDict, 'FDP': FDPCorrelationDict, 'AFD': AFDCorrelationDict} |
|
1 2 3 4 |
for party in parties: print(party) plotDict(allCorrelationDicts[party]) |
Plots der Korrelationsverläufe
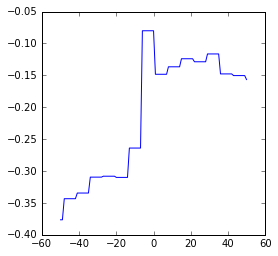
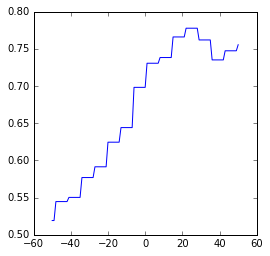
Wie bekannt, verschieben wir die Berichterstattung tageweise in der Zeit von -50 bis +50 Tage und berechnen die Korrelation des Google-News-Trends mit den erreichten Werten bei der Sonntagsfrage. Im Folgenden plotten wir diese Verläufe.
CDU

SPD
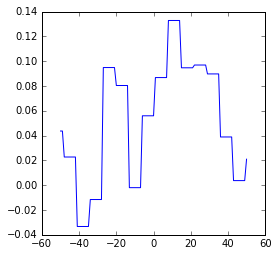
Linke
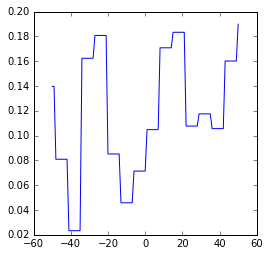
B90/Grüne
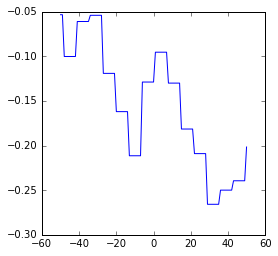
FDP
AFD
Beobachtungen aus den Korrelationsverläufen
Zunächst ist festzuhalten, dass die Korrelationen zwischen Umfragewerten und Google Trends bei keiner Partei auch nur in die Nähe der der AfD kommen. Wir fassen kurz zusammen:
- Die CDU ist stark antikorreliert (weniger Berichterstattung, bessere Umfrageergebnisse). Auch hier präzediert die Berichterstattung um etwa 30 Tage die Umfragewerte
- Bei keiner Partei außer CDU und AfD kann man von nennenswerter Korrelation sprechen
Fazit
Das bereits dargelegte Ergebnis, dass die Berichterstattung bei der AfD überproportional die Umfragewerte präzediert, ist im Vergleich mit den anderen Parteien umso deutlicher, da dort in den meisten Fällen nichtmal eine Korrelation vorliegt. Nur bei der Union kann eine statistische Aussage getroffen werden, nämlich antikorrelieren dort die Umfragewerte mit der Berichterstattung, ebenfalls mit etwa einem Monat Latenz.